Overview
Why it matters: Payroll is only one lens. Leaders also need to see who is on leave, which projects are overloaded, and how headcount trends—without exporting to BI for every question. The Activity Dashboard pulls HR, time, and project signals into one screen.
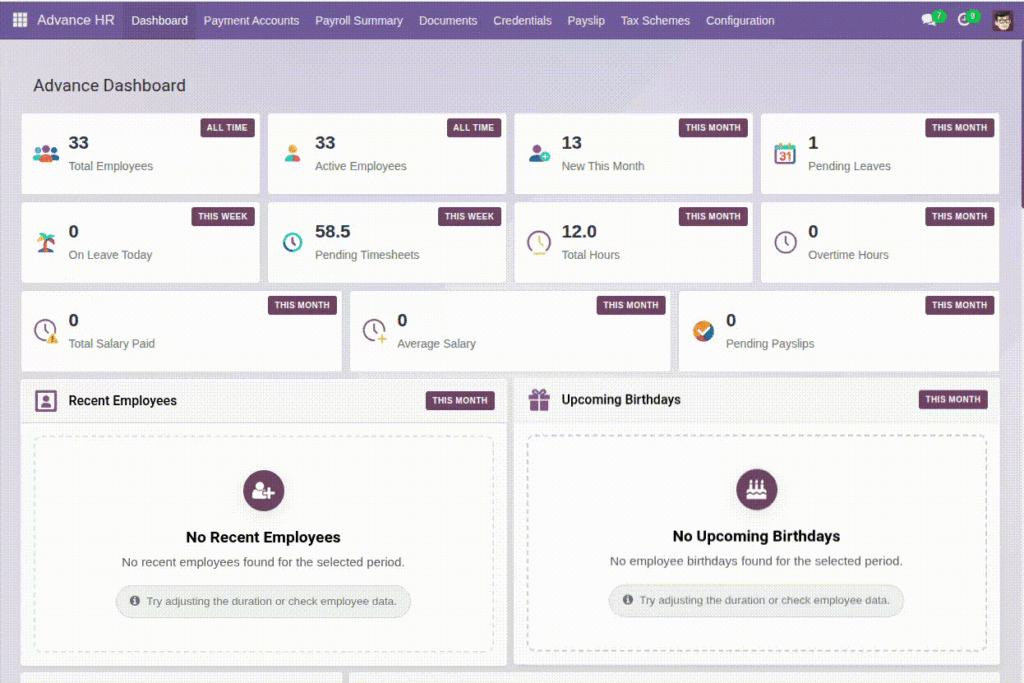
What this covers: The Dashboard menu under Advance HR opens a client view with configurable widgets: employee counts and lists, leave and holiday views, timesheet and OT summaries, task and department breakdowns, and salary-related widgets where applicable. Filters often include time range and scope.
Which widgets appear and how they are laid out is managed under Dashboard Widgets (Admin). The Widget dropdown there lists every built-in block by name; the tables below describe each option.
How It Works
Data is pulled from HR, Tasks, and Leaves. Administrators configure which widgets appear and their layout under Dashboard Widgets (Admin). End users can often change time range or filters on the client view.
Step-by-Step Guide
- Open the Activity Dashboard from the HR menu.
- Use filters to change time range or department.
- Review top-level metrics and drill down where needed.
Fields Table
On the live dashboard: filters and layout
| Label / control | Typical meaning | Example |
|---|---|---|
Time range / Duration |
Which period the widgets aggregate (set per widget in admin). |
This month |
User group (admin) |
Whether the row is aimed at User (self), Manager (department), or Admin (company). |
Manager |
Widget title |
One KPI block; title may be overridden by Label in configuration. |
Pending Leave Requests |
List / table / chart |
[list] compact rows; [table] tabular columns; [chart] visual trend or distribution. |
Overtime Analysis [chart] |
Employee statistics — widget names match the Configuration dropdown
| Widget name | Type | What it shows |
|---|---|---|
Total Employees [count] |
count |
All employee records (including archived unless the domain excludes them). |
Active Employees [count] |
count |
Employees with Active set. |
New Employees This Month [count] |
count |
Hires whose create date falls in the widget’s duration window. |
Recent Employees [list] |
list |
Up to five newest active hires in the period, with job title and “time ago”. |
Recent Employees [table] |
table |
Same data as the list in a table layout. |
Upcoming Birthdays [list] |
list |
Colleagues with birthdays in the next 30 days (from today), sorted soonest first. |
Upcoming Birthdays [table] |
table |
Same birthdays in table form. |
Employee Growth [chart] |
chart |
New joiners over time: by day (week ranges), week (month), month (year), or year (All time). |
Leave management
| Widget name | Type | What it shows |
|---|---|---|
Pending Leave Requests [count] |
count |
Leave requests in Draft or To approve with start date in the selected duration. |
Approved Leaves [list] |
list |
Validated leaves in the period: employee, department, dates, hours/days, type. |
Approved Leaves [table] |
table |
Same approved leaves in a table. |
Public Holidays [list] |
list |
Company/public calendar leaves (global calendar) overlapping the duration. |
Public Holidays [table] |
table |
Same holidays in table form. |
Employees On Leave Today [count] |
count |
Unique employees with validated leave covering today’s date. |
Employees On Leave Today [list] |
list |
Those employees with leave type, dates, and progress-style details. |
Employees On Leave Today [table] |
table |
Same “on leave today” set in a table. |
Leave Pattern Analysis [chart] |
chart |
Approved/validated leave volume grouped by time bucket (day/week/month depending on duration). |
Timesheet & overtime
| Widget name | Type | What it shows |
|---|---|---|
Pending Timesheets [count] |
count |
Aggregated “missing” working days versus expected coverage for the period (timesheet completeness signal). |
Total Logged Hours [sum] |
sum |
Sum of timesheet hours counted as fulfilled work time for the duration. |
Missing Hours [sum] |
sum |
Hours still expected vs logged (gap) across working days in the period. |
Total Overtime Hours [sum] |
sum |
Hours on analytic lines marked as overtime (OT work type) in the date range. |
Overtime Analysis [chart] |
chart |
OT hours grouped by period (e.g. day/week/month depending on duration). |
Salary & payroll
| Widget name | Type | What it shows |
|---|---|---|
Total Salary Paid [sum] |
sum |
Sum of gross salary on payslips in Paid status for months/years in the duration. |
Average Salary [avg] |
avg |
Average gross per matching paid payslip in the same filter. |
Salary Trend [chart] |
chart |
Gross salary trend across periods in the range. |
Monthly Salary [chart] |
chart |
Month-by-month salary totals for comparison. |
Pending Payslip Approvals [count] |
count |
Payslips still in Draft for employees in scope and period (awaiting lock/approval). |
Task management (requires Projects / tasks)
| Widget name | Type | What it shows |
|---|---|---|
Due Date Tasks [list] |
list |
Tasks assigned to scoped users: deadline overdue or within 7 days, not done/cancelled; rich row details. |
Due Date Tasks [table] |
table |
Same due-soon/overdue tasks grouped by project with urgency-style metrics. |
Due Date Tasks (Normal) [table] |
table |
Simpler flat list (up to 15) of due-soon/overdue tasks with status text. |
Due Date Tasks [chart] |
chart |
Chart of those tasks by period or grouping (deadline-focused). |
Over-allocated Tasks [list] |
list |
Tasks with a deadline in the period where logged timesheet hours exceed allocated hours on the task. |
Over-allocated Tasks [table] |
table |
Same over-allocation rows in table form. |
Task Analysis [list] |
list |
Per project: counts by state, completion rate, hours, top recent tasks (tasks created in duration). |
Task Analysis [table] |
table |
Project/task analysis in tabular layout. |
Task Analysis [chart] |
chart |
Chart view of project task volumes and states. |
Department Task Completion [list] |
list |
Done tasks in the period, grouped by assignee department: counts, hours, recent completions. |
Task Completion [chart] |
chart |
Counts of completed tasks and hours per time bucket (matches duration granularity). |
Department statistics
| Widget name | Type | What it shows |
|---|---|---|
Department Statistics [list] |
list |
Headcount share per department (employees counted when hire date falls in duration unless All time). |
Department Statistics [table] |
table |
Same department headcount breakdown in table form. |
Department Distribution [chart] |
chart |
Pie-style distribution of employees across departments for the filtered employee set. |
Field labels explained
Dashboard behaviour (all widgets)
Duration (per widget)
Set on each row in Dashboard Widget Visibility: This week, Last week, This month, Last month, This year, Last year, or All time. It drives date filters in the backend queries.
User group (User / Manager / Admin) User
limits data to the logged-in employee; Manager expands to their department; Admin uses company-wide employee scope.
Custom Label
Optional title override on the configuration row; if empty, the default title for that widget name is shown.
Employee widgets
Total Employees [count]
Headcount of all hr.employee records visible to the query.
Active Employees [count]
Employees with the Active flag set—typical “current workforce”.
New Employees This Month [count]
Count of profiles created between the duration start and end dates.
Recent Employees [list] / [table]
New hires in the window (up to five), ordered by create date; table variant suits wide screens.
Upcoming Birthdays [list] / [table]
Next occurrences within about 30 days; requires birthday filled on the employee form.
Employee Growth [chart]
Histogram of join dates—granularity adapts to the duration (e.g. weekly buckets for a month view).
Leave widgets
Pending Leave Requests [count]
Requests not yet validated whose start falls in the selected period.
Approved Leaves [list] / [table]
Validated time off overlapping the duration; useful for payroll and staffing reviews.
Public Holidays [list] / [table]
Entries from the global holiday calendar for the period.
Employees On Leave Today [count] / [list] / [table]
Validated absences where “today” sits between request start and end; count is unique people.
Leave Pattern Analysis [chart]
Shows how approved leave days stack up over the window—useful for spotting busy seasons.
Timesheet & overtime widgets
Pending Timesheets [count]
Roll-up of days that still need timesheet coverage vs expected working days (not a simple “draft timesheet” count).
Total Logged Hours [sum]
Consolidated logged time for analytic lines in the date range.
Missing Hours [sum]
Expected minus logged hours, using working-day and hours-per-day rules from employee and settings.
Total Overtime Hours [sum]
Sum of OT-type timesheet lines—aligns with your timesheet work types.
Overtime Analysis [chart]
OT trend to spot spikes by team or period.
Salary & payroll widgets
Total Salary Paid [sum]
Gross on payslips marked paid; filtered by month/year when not All time.
Average Salary [avg]
Mean gross across paid payslips in the filter—sensitive; often restricted to payroll groups.
Salary Trend [chart] / Monthly Salary [chart]
Long-run and month-by-month views of the same paid payslip totals.
Pending Payslip Approvals [count]
Draft payslips awaiting your lock/approval workflow.
Task widgets
Due Date Tasks (all variants)
Focus on open tasks with deadlines: overdue or due within seven days, assigned to users linked to scoped employees.
Over-allocated Tasks [list] / [table]
Only tasks where timesheet hours already exceed the task’s allocated hours and the deadline falls in the period—true “burned past estimate” cases.
Task Analysis (list / table / chart)
Project-centric analytics for tasks created in the period: states, completion rates, hours.
Department Task Completion [list]
Aggregates done tasks by department for the duration; includes productivity-style scores in the UI.
Task Completion [chart]
Throughput of finished tasks and hours over time.
Department Task Completion [chart]
Compares completed workload across departments over the same time buckets.
Department widgets
Department Statistics [list] / [table]
Per-department employee share; percentages use the filtered set. When duration is not All time, employees are filtered by profile create date.
Department Distribution [chart]
Headcount mix across departments for the visible employee set—good for diversity-of-workload conversations.
Tips
- Check weekly to balance project assignments.
- Use leave widgets to anticipate staffing gaps.
Common Mistakes
- Ignoring spikes in overtime—often a sign of workload issues.
- Not updating filters, leading to misleading numbers.