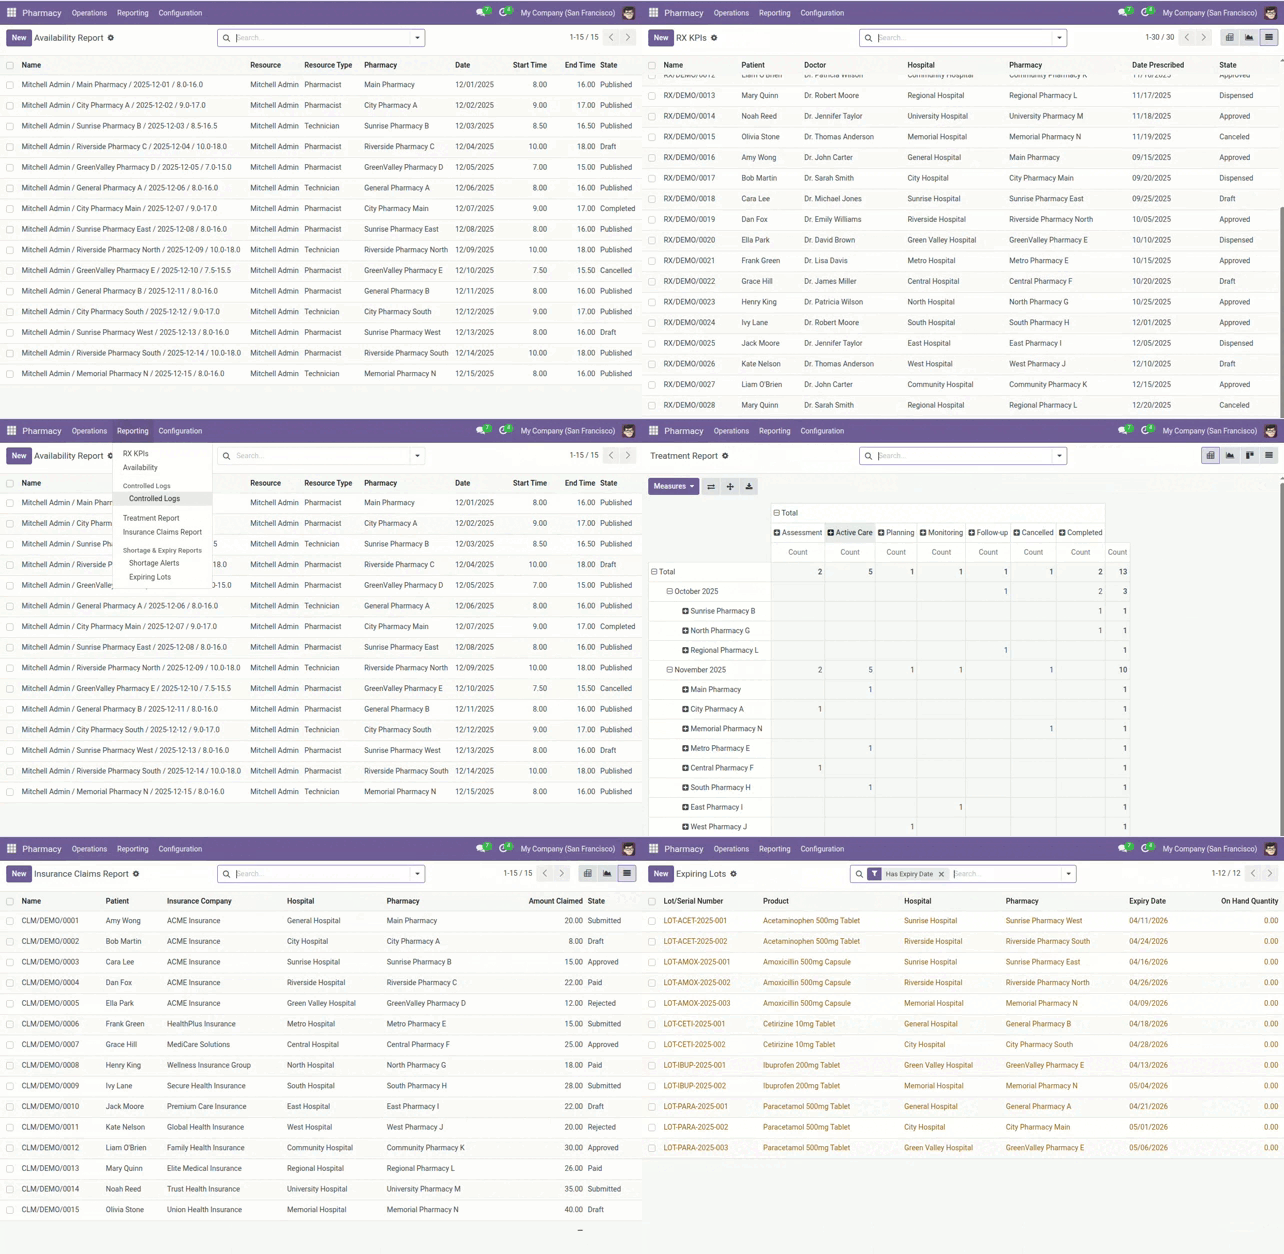
Use dashboards to monitor prescriptions, availability, controlled logs, treatments, and claims.
Overview
Reports surface what’s working and what needs improvement across hospitals and branches. Each report can be filtered and viewed as a list, pivot, or chart, letting you quickly move from a high‑level KPI to the line items behind it. Saving favorite filters helps your team monitor recurring goals with one click.
Use these insights to balance staffing, reduce expiries, speed up claims, and coach branches toward consistent, high‑quality service.
How It Works
- RX KPIs: Prescription counts by hospital/branch/doctor.
- Availability: Staffing publication and coverage.
- Controlled Logs: Actions for controlled drugs.
- Treatment Report: Treatment volumes and states.
- Insurance Claims Report: Claim states and amounts.
- Shortage & Expiry: Alerts and expiring lots.
Step-by-Step Guide
- Go to Pharmacy → Reporting.
- Open a report, use filters (Hospital, Pharmacy, Date), and switch views (List, Pivot, Graph).
- Save favorite filters for quick reuse.
Example Metrics
| Report | What It Shows | Example |
|---|---|---|
RX KPIs |
Prescriptions volume and trends. |
250 RX this month |
Controlled Logs |
Dispense/Return/Destroy counts. |
15 Destroy events |
Treatment Report |
Active vs Done episodes. |
42 Active, 31 Done |
Insurance Report |
Submitted/Approved/Paid claims. |
USD 12,450 paid |
Expiry Lots |
Lots expiring in 30 days. |
23 lots |
Tips
- Filter by Pharmacy to coach branch performance and spot bottlenecks.
Field Names Explained
RX KPIs
Volumes and trends for prescriptions by site/doctor.
Availability
Staffing publication and coverage metrics.
Controlled Logs
Counts of Dispense/Return/Destroy actions.
Treatment Report
Active vs Done episodes and durations.
Insurance Report
Submitted/Approved/Paid totals and counts.
Expiry Lots
Lots expiring within the next 30 days.
Common Mistakes
- Comparing branches without consistent coverage targets can mislead decisions—standardize first.
Image