Overview
Predictive Analytics uses asset history, maintenance records, and usage patterns to forecast when equipment might fail or need service. Instead of waiting for breakdowns, your team gets early warnings and recommended actions.
Analysis types include remaining useful life (RUL), failure pattern analysis, performance trending, and maintenance prediction.
How It Works
The system runs scheduled analyses and stores results on each asset. Key outputs include failure probability (30/90/180 days), performance score, predicted next maintenance date, and an overall risk level (Low, Medium, High, Critical).
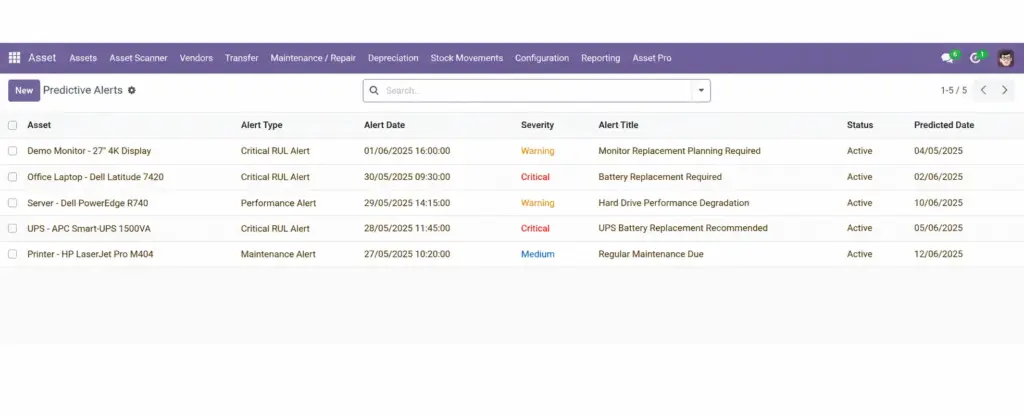
Alerts can notify managers when assets reach critical risk so they can schedule preventive work before failures occur.
Step-by-Step Guide
- Go to Asset Pro > Operations > Predictive Analytics.
- Select an asset or review the list sorted by risk level.
- Open an analysis record to see failure probabilities, RUL days, and performance trend.
- Read the Recommended Actions section for suggested next steps.
- Create a maintenance schedule from the recommendations if service is due.
- Review critical and high-risk assets weekly in team meetings.
Fields Table
| Field Name | Description | Example |
|---|---|---|
Analysis Type |
Kind of prediction performed. |
Failure Pattern Analysis |
Current RUL (Days) |
Estimated remaining useful life. |
180 days |
RUL Confidence (%) |
How confident the estimate is. |
85% |
Failure Probability (30 days) |
Likelihood of failure within 30 days. |
12% |
Failure Probability (90 days) |
Likelihood within 90 days. |
35% |
Performance Score |
Overall health score. |
72 / 100 |
Performance Trend |
Direction of performance over time. |
Declining |
Predicted Next Maintenance |
Suggested service date. |
2025-05-15 |
Recommended Actions |
System-suggested steps. |
Schedule belt inspection within 14 days |
Field Explanations
Analysis Type
Different analyses answer different questions – RUL for replacement planning, failure patterns for reliability.
Current RUL (Days)
Plan replacements before equipment dies in production.
RUL Confidence (%)
Higher confidence means more reliable data supported the estimate.
Failure Probability (30 days)
Above 40% warrants immediate inspection for critical equipment.
Failure Probability (90 days)
Use for quarterly maintenance planning and budget requests.
Performance Score
Compare similar assets – low scores may indicate neglect or heavy use.
Performance Trend
Declining trend with high failure probability means act now.
Predicted Next Maintenance
Starting point for scheduling – adjust based on technician availability.
Risk Level
Filter the list by Critical and High to prioritize daily work.
Recommended Actions
Plain-language guidance – follow up even if you disagree with the timeline.
Tips (Pro Tips)
- Feed the system good data – consistent maintenance records improve prediction accuracy.
- Focus on Critical and High risk assets first; Low risk can wait for routine reviews.
- Combine predictions with the maintenance scheduler to turn insights into action.
Common Mistakes
- Ignoring declining performance trends because the asset “still works” – failures are often sudden.
- Expecting 100% accurate predictions – treat them as guidance, not guarantees.
- Not recording maintenance history – predictions rely on historical data quality.
Visual Reference