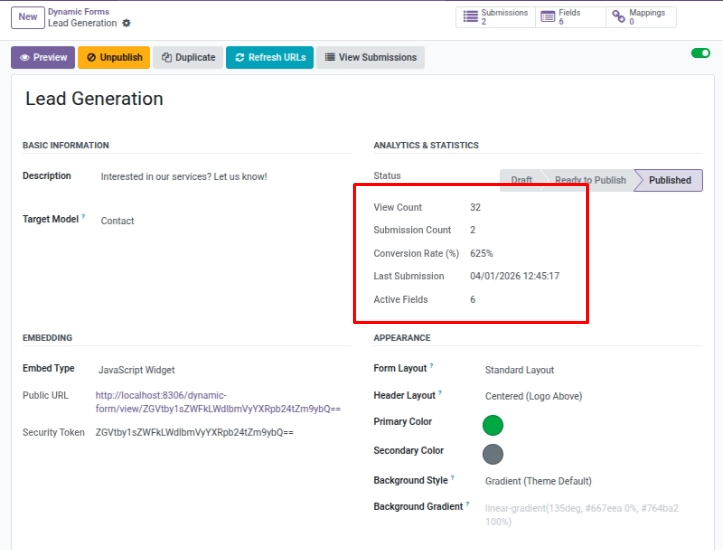
Understand performance with views, submissions, and conversion rate.
Overview
This chapter helps you understand how your forms are performing. Instead of guessing, you can measure whether people are viewing the form and how many actually complete it.
You can use analytics to answer questions like:
- How many people opened the form?
- How many people submitted it?
- What is the conversion rate (submissions compared to views)?
Example: If many people view the form but few submit, your form might be too long, unclear, or asking for too much information too early.
How It Works
When the form loads, a view is counted. When someone submits, the submission count increases. Conversion rate is calculated automatically.
Step-by-Step Guid
- Open your form to see view and submission counts.
- Use Submissions to export data as CSV.
- Look at Last Submission date to know recent activity.
Fields Table
| Label | Description | Example |
|---|---|---|
Form views |
How many times the form was viewed. |
325 |
Submissions |
Number of completed submissions. |
58 |
Conversion rate |
Submissions divided by views, shown as %. |
17.85 |
Last submission |
Date and time of the most recent submission. |
2026-03-20 14:22 |
Fields explanation
Form views
Total number of times the form was opened/viewed
Submissions
Total number of successful submissions
Conversion rate
Percentage of views that became submissions
Last submission
The most recent submission date/time
Tips
- Test different layouts to improve conversion.
- Shorter forms tend to convert better.
Common Mistakes
- Comparing conversion across very different traffic sources.