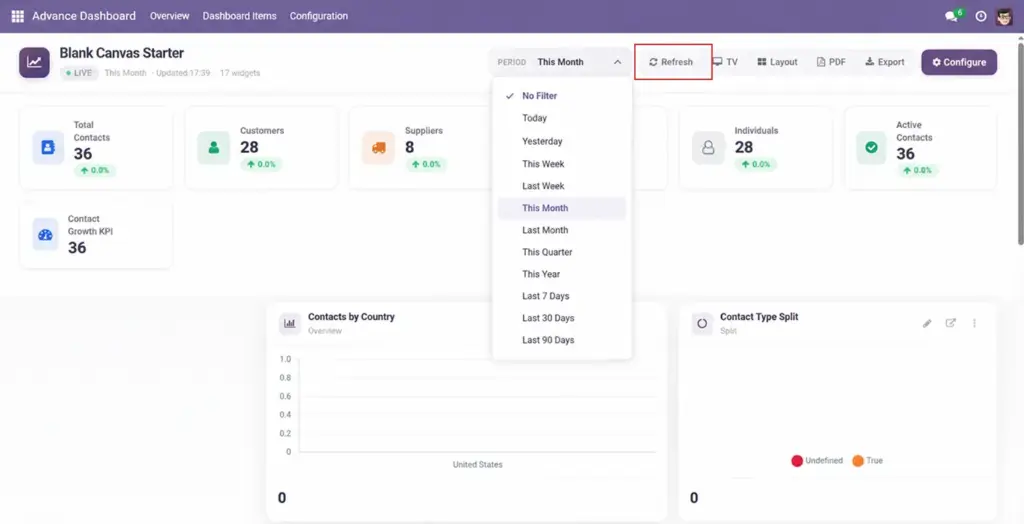
Control what time period your dashboard shows and keep data fresh automatically.
Overview
Every dashboard can filter data by time – today, this week, this month, last 30 days, and more. You set a default period when creating the dashboard, and viewers can change it anytime using the date picker at the top of the live view. You can also enable auto-refresh so the dashboard reloads data every few seconds or minutes without anyone clicking refresh.
How It Works
When you open a dashboard, all widgets use the selected date period. Each widget has a Date Filter Field (like “Order Date” or “Create Date”) that tells the system which date column to filter. When you change the period at the top, every widget recalculates instantly. KPI tiles also compare against the previous period and show a trend arrow (up or down).
Step-by-Step Guide
Set the Default Period
- On the dashboard form, choose “Default Date Filter” (e.g., This Month). This is what viewers see when they first open the dashboard.
Configure Widget Date Fields
- On each widget, set “Date Filter Field” to the date column that matters (e.g., date_order for sales, create_date for leads).
Change Period While Viewing
- Open the dashboard. Use the date dropdown at the top to switch between Today, This Week, Last 30 Days, etc. All widgets update immediately.
Use Custom Date Range
- Some views allow picking exact start and end dates for precise reporting.
Enable Auto Refresh
- On the dashboard form, set “Auto Refresh” to your preferred interval (15 seconds to 10 minutes). The dashboard reloads data automatically.
Watch Trend Arrows
- KPI tiles show a percentage change vs the previous equivalent period (e.g., this month vs last month).
Date Filter Options
| Filter Name | Description | Example Use |
|---|---|---|
No Filter |
Shows all records regardless of date |
Total customer count (all time) |
Today |
Only records from today |
Today’s sales orders |
Yesterday |
Only records from yesterday |
Yesterday’s deliveries |
This Week |
Monday through today |
Weekly team performance |
Last Week |
Previous Monday to Sunday |
Last week’s summary report |
This Month |
First of month through today |
Monthly revenue tracking |
Last Month |
Full previous calendar month |
Month-end closing report |
This Quarter |
Current quarter to today |
Quarterly sales review |
This Year |
January 1 through today |
Year-to-date performance |
Last 7 Days |
Rolling 7-day window |
Recent activity snapshot |
Last 30 Days |
Rolling 30-day window |
Monthly trend without calendar boundaries |
Last 90 Days |
Rolling 90-day window |
Quarterly trend analysis |
Field Explanations
Default Date Filter
The time period applied when someone first opens the dashboard. Viewers can override this using the date picker.
Date Filter Field (on widgets)
Which date column on the record type is used for filtering. Must be set on each widget for date filtering to work.
Auto Refresh
How often the dashboard automatically reloads data. Options from 15 seconds to 10 minutes. Set to “None” for dashboards viewed occasionally.
Trend Arrow (KPI tiles)
Automatically compares the current period with the previous equivalent period and shows % change. Green arrow = improvement, red = decline.
Tips
- Set “This Month” as the default for most business dashboards – it is the most common reporting period.
- Use Auto Refresh (1–5 minutes) on dashboards displayed on office TVs so numbers stay current.
- For wallboards, combine Auto Refresh with TV Mode for a fully hands-free experience.
- KPI Comparison widgets are ideal for showing period-over-period change at a glance.
Common Mistakes
- Widget shows all-time data despite date filter – the widget’s Date Filter Field is not set. Fix it on the widget form.
- Auto Refresh set too fast (15 seconds) on a heavy dashboard – this can slow down the server. Use 1–5 minutes instead.
- Comparing “This Month” trend when today is the 1st – the previous period may be a full month while current has only one day of data.
Image