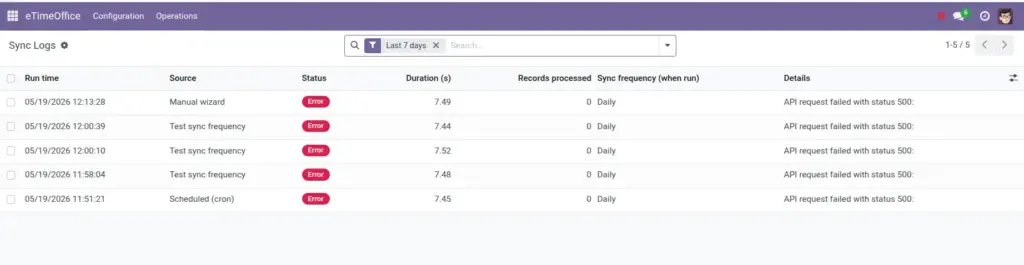
Use Sync Logs to prove a job ran, how long it took, and what it did.
Overview
Every automatic run, manual wizard completion, “test sync frequency” click, and certain API-triggered runs creates a read-only line under eTimeOffice → Configuration → Sync Logs. You can filter to the last seven days, show only errors, or group by day for management review.
How it works
Each log stores the trigger type (scheduled job, manual wizard, test button, or API), a success/error/skipped badge, optional record counts, duration in seconds, the sync frequency label that was active at that moment, and a free-text message with technical detail when needed.
Step-by-step guide
- From settings click Sync run logs or open eTimeOffice → Configuration → Sync Logs.
- Apply the Last 7 days filter for routine health checks.
- Click a line to read the full message-for example API HTTP errors or “integration disabled.”
- If state is Skipped, read the message: it often explains that the integration switch was off.
Fields table
| Field name | Description | Example |
|---|---|---|
Run time |
When the entry was created (end of the run). |
2026-05-01 06:00:04 |
Source |
What kicked the job. |
Scheduled (cron) |
Status |
Success, Error, or Skipped. |
Success |
Duration (s) |
How many seconds the attempt lasted. |
12.4 |
Records processed |
Count of punch rows handled when reported. |
136 |
Sync frequency (when run) |
Human label of the frequency parameter at run time. |
Daily |
Details |
Long message-success summary or error text. |
Automatic sync completed… |
Field explanations
Run time
The moment this log line was created-effectively when the attempt finished-so you can line it up with server maintenance windows.
Source
Whether a human (manual wizard), the scheduler (cron), the Test Sync Frequency button, or an API call started the run.
Status
Success means the routine finished without a hard failure; Error means read the details for HTTP or parsing problems; Skipped means business rules blocked work (for example integration switched off)-not the same as a crash.
Duration (s)
How long the attempt took end-to-end; sudden spikes often mean a huge date range or a slow network path to eTimeOffice.
Records processed
How many punch rows the job reported handling when Odoo could count them; zero can still mean “nothing new” rather than “broken.”
Sync frequency (when run)
The label of your frequency setting at the moment the job ran-useful when someone changed from hourly to daily mid-week.
Details
The long text message with the human-readable summary or the raw error string; copy this field first when opening a vendor ticket.
Tip: Save a weekly calendar reminder to scan errors; fixing credentials early prevents silent gaps.
Common mistakes
- Assuming “no logs” means “no problems”-it can mean nobody has synced yet or filters hide older entries.
- Ignoring Test source lines after pressing Test Sync Frequency-they look like duplicates but prove the button path works.
Image