Overview
Reporting turns daily support activity into clear business insights that help teams improve service quality over time. Instead of relying on assumptions, managers can review real data for ticket volume, SLA outcomes, customer satisfaction, and team productivity. This makes planning, coaching, and process improvement more accurate and practical.
How It Works
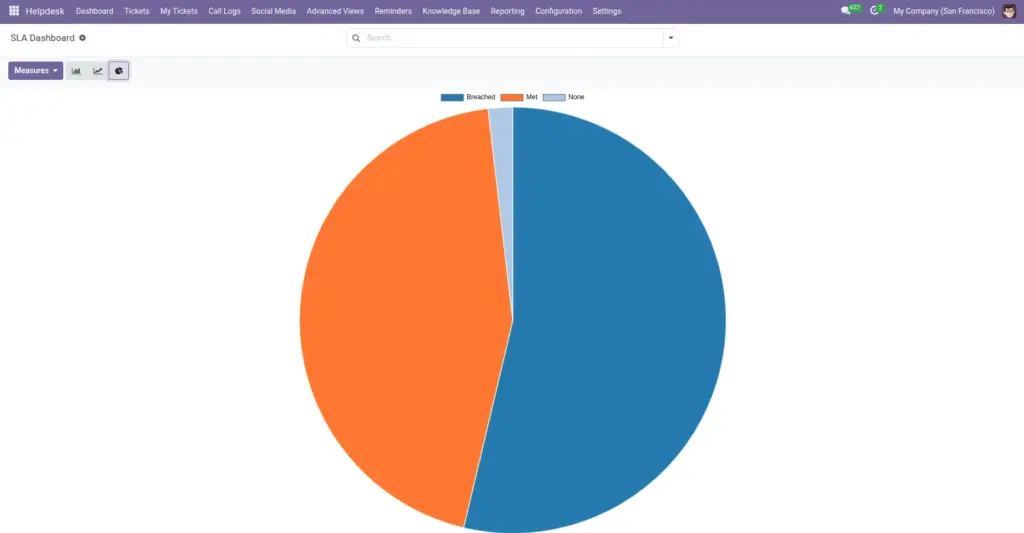
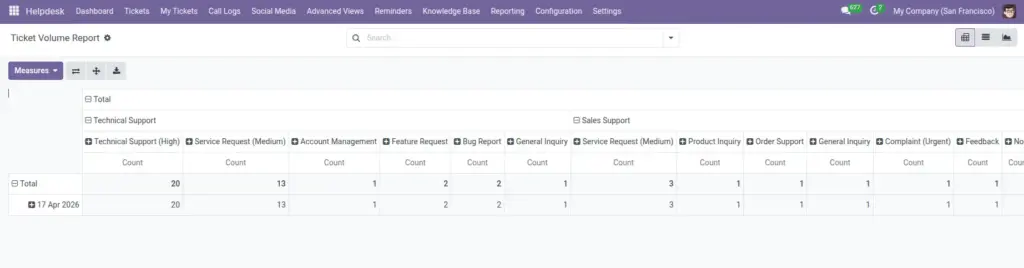
The system collects information from ticket operations, SLA monitoring, and customer feedback, then presents it through dashboards and report views. Users can apply filters by period, team, category, and other dimensions to identify trends and exceptions. These insights help leadership detect bottlenecks early, balance team capacity, and improve both speed and customer experience.
Step-by-Step Guide
- Open Reporting menu.
- Choose report type such as Ticket Volume or SLA Dashboard.
- Apply filters for team, date range, or ticket type.
- Compare trends and identify weak points.
- Share actions with team and track improvement next cycle.
Fields Table
| Field Name | Description | Example |
|---|---|---|
Ticket Volume |
Total number of tickets in selected period. |
428 tickets this month |
SLA Compliance |
Percentage of tickets meeting SLA. |
91% |
Response Time Analytics |
Average first response speed. |
1h 42m average |
Resolution Time Analytics |
Average full resolution duration. |
9h 10m average |
SLA Breach Report |
List of tickets that missed SLA targets. |
37 breached tickets |
Customer Satisfaction |
Feedback score trend from customers. |
4.2 / 5 average rating |
Fields Explanation
Ticket Volume
Shows demand level on your team.
SLA Compliance
Indicates reliability of service promises.
Response Time Analytics
Measures how quickly customers hear back.
Resolution Time Analytics
Measures end-to-end solving speed.
SLA Breach Report
Helps identify delays and root causes.
Customer Satisfaction
Reflects service quality from customer perspective.
Tips
- Review reports weekly, not only monthly.
- Use team-level filters to coach fairly.
- Track both speed and quality to avoid rushed closures.
Common Mistakes
- Looking at volume only without SLA and satisfaction.
- Comparing teams without same date filters.
- Ignoring repeated breach categories.
Image