Go beyond flat lists: configure pivot tables, bar/line/pie graphs, kanban columns, and calendar views from the template form.
Overview
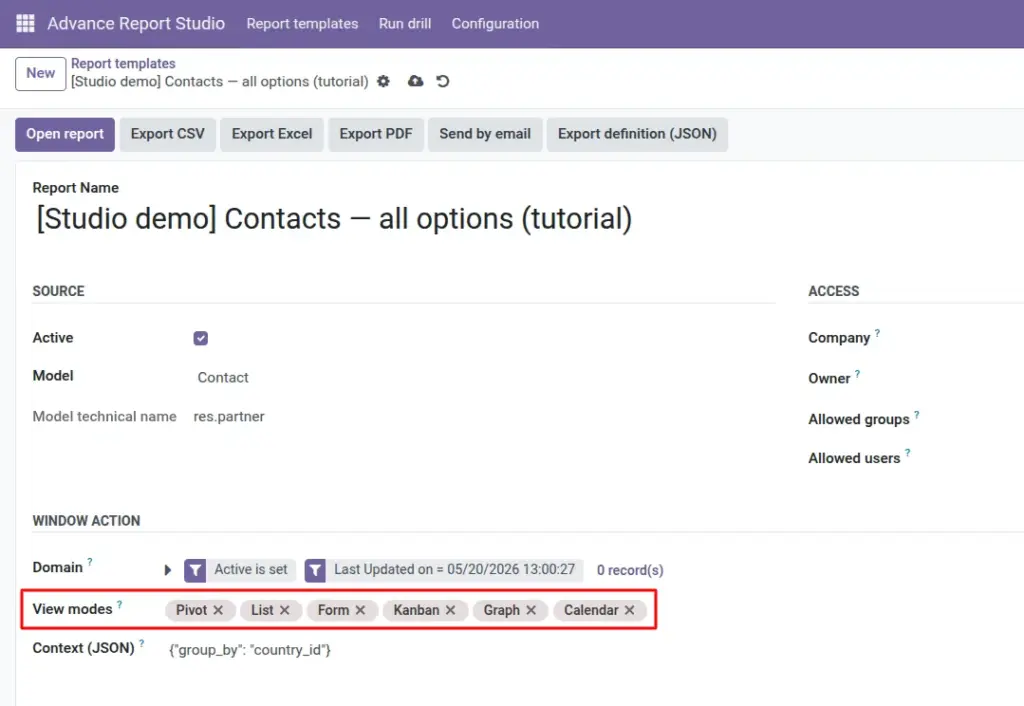
Advance Report Studio opens standard Odoo analytics views-not a separate BI tool. On each template you choose View modes (list, form, pivot, graph, kanban, calendar where supported), then define how data is grouped and measured.
Pivot uses row and column group-by lines. Graph uses chart type, measure (numeric field or record count), and group-by lines. Kanban uses group-by lines for column headers. Settings sync to technical fields used at runtime and included in JSON export.
How it works
View modes are stored as many2many tags linked to options (list, form, pivot, graph, kanban, calendar). Order is preserved when possible; the first mode in the chain is typically what opens first-demo Contacts – graph & kanban opens Graph first.
Pivot/graph/kanban lines support date intervals on date/datetime fields: year, quarter, month, week, day, hour, minute (stored as field_name:month style specs).
Calendar is only allowed if the target model has a suitable calendar view in Odoo; otherwise save fails with a clear validation message.
Graph measure rules
- Enable Record count to chart number of rows (
__count). - Or pick a numeric Graph measure field (integer, float, monetary).
- You cannot enable both-Odoo validates this on save.
Step-by-step
- On the template, under Window action, select View modes tags (include pivot and/or graph and/or kanban as needed).
- In Pivot, add row lines (e.g. Customer, Order date → month) and optional column lines (e.g. Status).
- In Graph & Kanban, set Graph chart type (bar, line, pie, or default).
- Choose Record count or a Graph measure field (e.g. Total amount on sales orders).
- Add Graph group by lines (e.g. Customer, Country).
- Add Kanban group by lines (e.g. Status for order cards).
- Save and Open report; switch views using Odoo’s view switcher.
- Adjust domain if the chart is empty or too crowded.
Fields reference
| Field | Description | Example |
|---|---|---|
View modes |
Enabled window views and open order. |
graph, kanban, list, form, pivot |
Pivot row group by (fields) |
Row dimensions with optional date interval. |
partner_id, date_order:month |
Pivot column group by (fields) |
Column dimensions. |
state |
Graph chart type |
bar, line, pie, or default from view. |
Bar |
Record count |
Measure number of records in graph. |
Contacts per country |
Graph measure field |
Numeric field to sum/average. |
amount_total |
Graph group by (fields) |
Graph X-axis / series dimensions. |
partner_id |
Kanban group by (fields) |
Kanban column grouping. |
state, country_id |
Field explanations
Each block matches one row in the table above, in the same order.
View modes
Many2many tags on the template (under Window action) listing which Odoo window views are available: list, form, pivot, graph, kanban, and calendar when the model supports it. Synced to the technical view_mode string; first mode in the chain often opens first. Include pivot/graph/kanban only if you configured the matching lines below.
Pivot row group by (fields)
One2many lines under the Pivot section: each line picks a field on the template model and optional date interval (year, quarter, month, week, day, …). Order + sequence produce the pivot row dimension stack (e.g. customer, then order month).
Pivot column group by (fields)
Second one2many under Pivot: dimensions that appear as pivot columns (e.g. workflow state). Same date-interval options as rows. Leave empty for a single-column pivot.
Graph chart type
Selection: Default (from view), Bar, Line, or Pie. When Graph is in view modes, this sets Odoo’s graph chart style (graph_mode in context). “Default” defers to the model’s standard graph view.
Record count
Boolean “Graph measure: record count”. When enabled, the graph measures __count (number of records) instead of a numeric field. Mutually exclusive with Graph measure field-Odoo raises a validation error if both are set.
Graph measure field
Optional many2one to ir.model.fields limited to integer, float, or monetary fields on the template model. The value aggregated in the graph (e.g. amount_total). Cleared automatically when Record count is turned on.
Graph group by (fields)
One2many under Graph & Kanban: dimensions for the graph (X-axis / series), with optional date intervals. Synced to the technical graph_groupby string used at runtime and in exports.
Kanban group by (fields)
Parallel one2many for kanban columns: which field(s) group cards when Kanban is in view modes. Can match graph group-by (e.g. country) or differ (e.g. state on kanban, customer on graph).
Tips
- Tip: Prefer stored fields for group-by and measures so Odoo aggregates reliably.
- Tip: Put the view users should see first at the beginning of view modes (e.g. graph,kanban,list,form).
- Tip: Use list search filters Uses graph/Graph measure: countto audit chart templates.
Common mistakes
- Common mistake: Enabling both record count and a measure field-clear one before save.
- Common mistake: Adding Calendar for models without calendar views-remove Calendar from view modes.
- Common mistake: Expecting exported Excel to match pivot layout-exports are flat row lists (see Export chapter).
Image