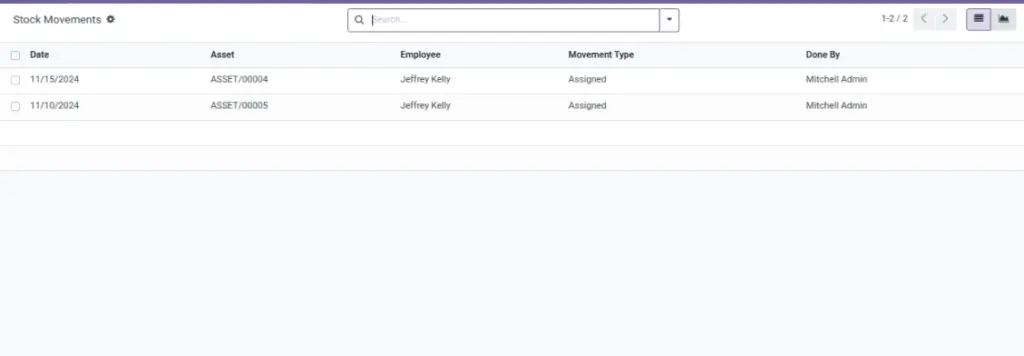
This report shows assignment and return activity for stock‑managed assets (Model Type = Multiple Assets). It answers questions like “How many monitors were assigned this week?” and “Who returned items recently?”
Overview
Go to Asset → Stock Movements. You can view the report as a list or as a simple bar graph. Use filters to focus on assigned vs returned movements.
How it works
- Assigned movements come from transfer entries with an assign date.
- Returned movements come from transfer entries with a return date.
- The report includes the employee, date, and who recorded the action.
- Only assets marked as Multiple Assets appear here.
Why this matters: it gives you a clear timeline of stock going out and coming back.
Step-by-step guide
Open Stock Movements
Go to Asset → Stock Movements.
Filter what you need
Use the filters Assigned and Returned.
Group by asset or employee
Use “Group By” to summarize by Asset, Employee, Movement Type, or Date.
Switch to Graph view for a quick snapshot
Use the graph view to see activity volume at a glance.
Fields table (menu cheat‑sheet)
| Field Name | Description | Example |
|---|---|---|
Date |
When the assignment or return happened. |
2025‑03‑10 |
Asset |
The stock‑managed asset record. |
Monitors (ASSET/00005) |
Employee |
Who received/returned the asset. |
Alex Johnson |
Movement Type |
Whether it was assigned out or returned. |
Returned |
Done By |
Who recorded the action in Odoo. |
IT Admin |
Field explanations
| Field Name | Explanation |
|---|---|
Date |
The assignment or return date recorded for the movement. |
Asset |
The stock‑managed asset that moved (only “Multiple Assets” appear here). |
Employee |
Employee who received or returned the item; useful for tracing usage. |
Movement Type |
“Assigned” = stock went out; “Returned” = stock came back in. |
Done By |
User who recorded the action; useful for clarifications and audits. |
Tips
- Use Group By Date to see daily/weekly activity.
- Use Group By Employee to quickly find heavy users of shared equipment.
- Keep transfers clean: the report is only as accurate as your transfer dates.
Common mistakes
- Expecting Single Assets here: this report is only for Multiple Assets.
- Missing return dates: “Returned” movements won’t appear if return date is blank.
- Confusing who has stock: use Transfer entries for the source of truth.
Image placeholder