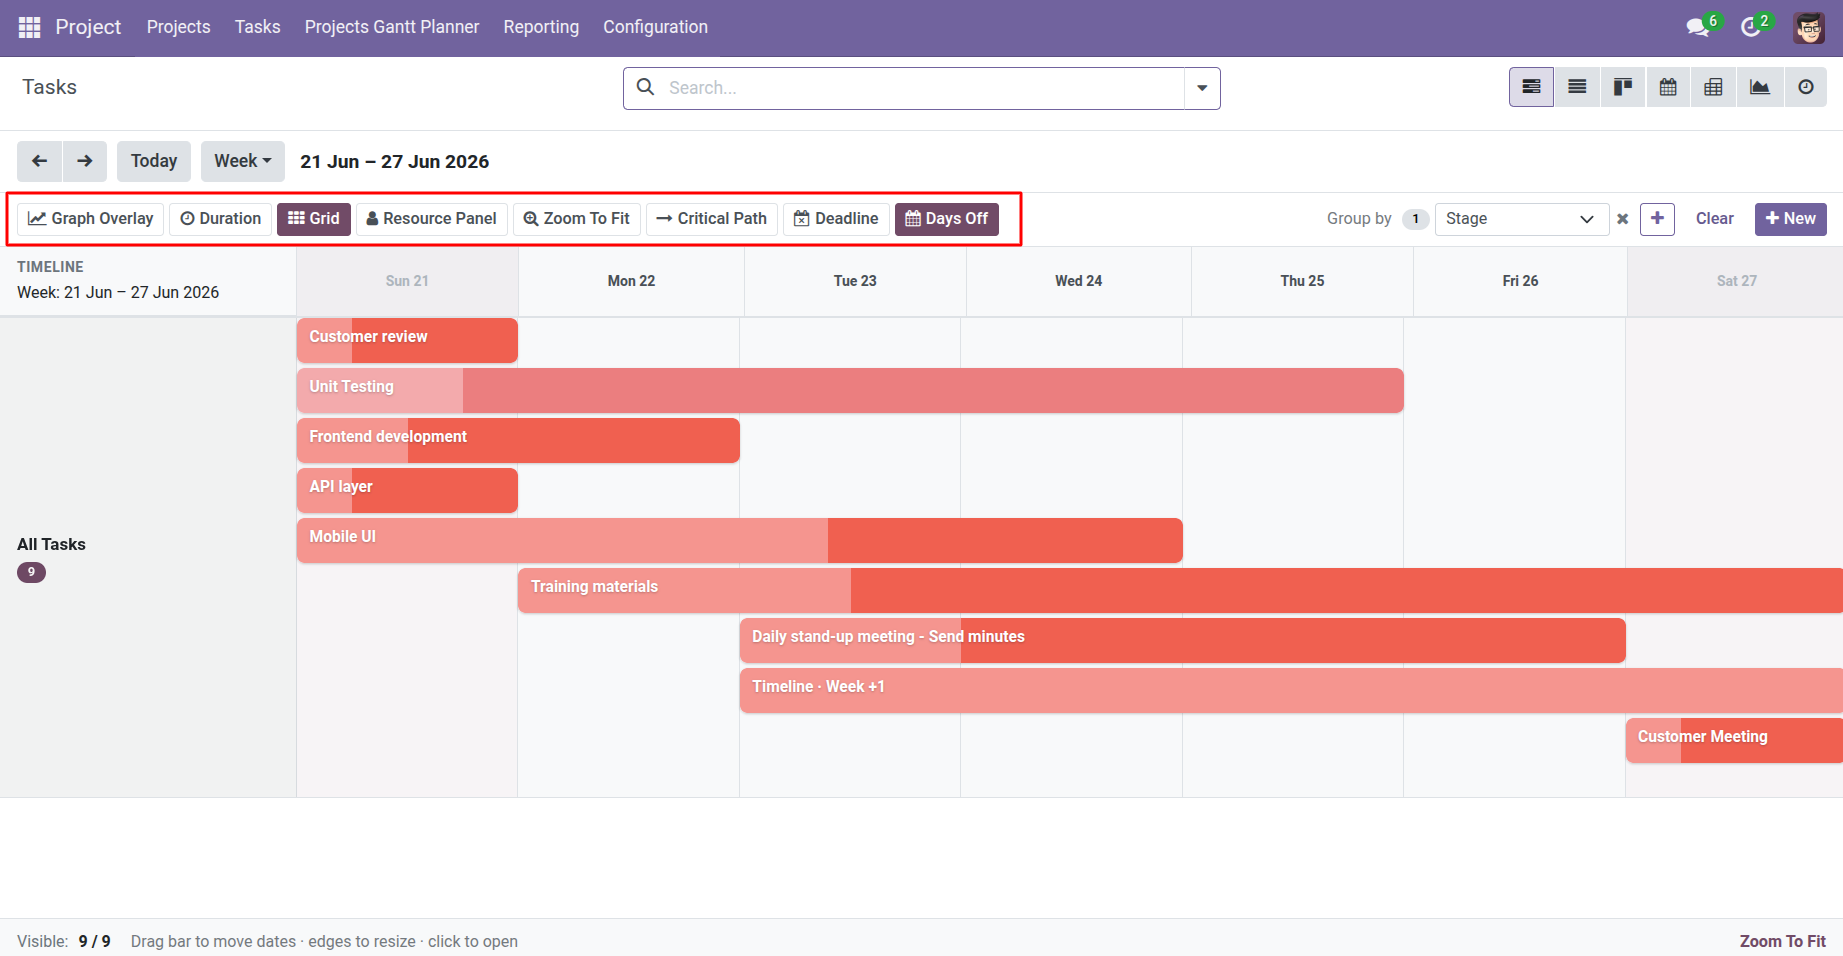
Graph overlay, grid, resources, critical path, deadlines, and more visual helpers.
Overview
Below the date navigation bar, the facilities toolbar offers buttons that change how you read the chart – without changing your data. Turn on duration labels, weekend shading, a resource summary panel, and other aids as needed.
How It Works
Each button toggles a display option. Active buttons appear highlighted.
- Graph Overlay – Shows a shaded band and mini progress bar per group row summarizing average completion.
- Duration – Prints the task length on each bar (e.g., “3d”).
- Grid – Vertical column lines aligned with the time scale for easier reading.
- Resource Panel – Side panel listing assignees, task counts, allocated hours, and workload bars (tasks Gantt only).
- Zoom To Fit – Jumps the timeline to include all scheduled items.
- Critical Path – Highlights dependent tasks with no schedule float (tasks Gantt only).
- Deadline – Shows diamond markers where task deadlines fall on the timeline.
- Days Off – Shades weekend columns (works with the Settings weekend option).
- New – Creates a new task (if you have permission).
Step-by-Step Guide
- Open the Tasks or Projects Gantt.
- Click Grid if vertical lines help you align bars to dates.
- Click Duration to see how long each task runs without opening forms.
- Click Graph Overlay during a status meeting to show group-level progress at a glance.
- Click Resource Panel to open the assignee sidebar – review who has the most tasks and hours.
- Click Deadline to compare planned bars against official due dates.
- Click Days Off to dim Saturdays and Sundays.
- Click any active button again to turn that feature off.
Fields Table
| Field Name | Description | Example |
|---|---|---|
Graph Overlay |
Group-level progress summary band on each row |
65% average in sidebar |
Duration Label |
Text on bars showing planned length |
2d, 4h |
Grid Lines |
Vertical dividers matching time columns |
On / Off |
Resource Panel |
Assignee list with task count and hours |
Jane: 5 tasks · 24 h |
Deadline Marker |
Icon on timeline at task deadline date |
◆ on 15 Jun |
Days Off Shading |
Weekend column background |
Sat-Sun shaded |
Allocated Hours |
Used in resource panel totals |
8 hours per task |
Field Explanations
Graph Overlay
A colored span behind bars showing the time range covered by tasks in that group, with fill percentage for average progress. Great for executive summaries.
Duration Label
Quick read of bar length in days or hours depending on zoom. Saves clicking into each task during planning sessions.
Grid Lines
Makes it easier to see which day or hour a bar starts and ends, especially in week or day view.
Resource Panel
Lists everyone assigned to visible tasks. The bar shows relative workload – useful for balancing work across the team.
Deadline Marker
Shows where the deadline falls even if the planned bar ends earlier or later. Spot misalignment between plan and commitment.
Days Off Shading
Visually separates weekends from weekdays. Helps when most work happens Monday-Friday.
Allocated Hours
Expected effort on the task. Summed per assignee in the resource panel to estimate load.
Tips
- Combine Deadline + Duration when reviewing whether your plan fits promised delivery dates.
- Resource Panel respects current filters – filter to one project to see that team’s workload only.
Common Mistakes
- Empty resource panel Tasks need assignees. Unassigned tasks won’t appear in the resource list.
- Looking for Critical Path on Projects Gantt Critical Path is available on the Tasks Gantt only, not the project-level chart.
Image