Overview
This page explains how to use the Profit/Loss Graph report to compare projects quickly. It’s best for “big picture” questions like: “Which projects need attention this week?”
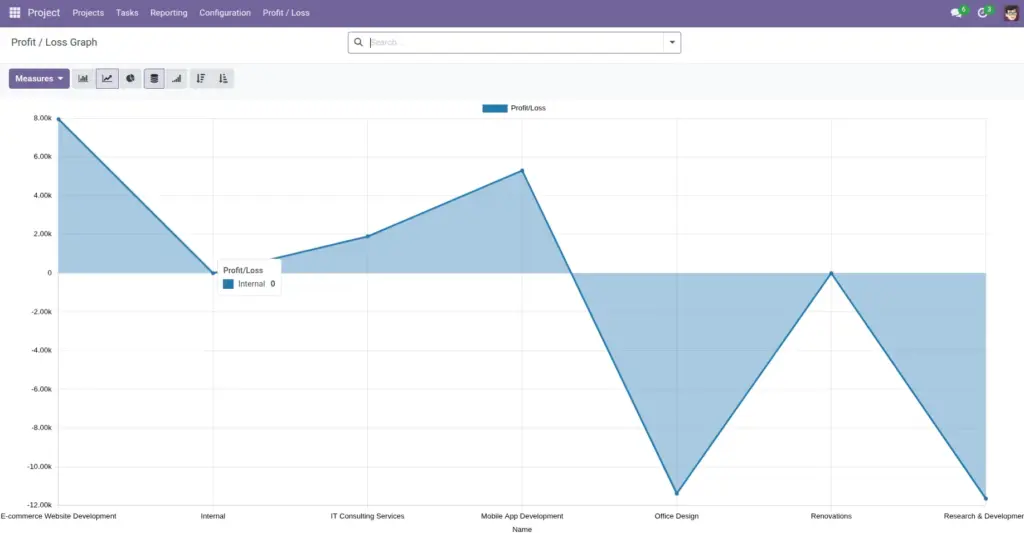
The Profit/Loss Graph shows each project’s Profit/Loss value in a graph, so you can spot outliers without opening every project. This report is typically available to Administrators only.
Real-life example: you notice one project trending negative. You open it, then check Client Costs (Paid payments), Employee Expense (time cost), and External Expenses to find the reason.
How it works
- Where to find it: Projects → Reporting → Profit/Loss Graph.
- What it shows: projects (by name) and their Profit/Loss value.
- How to use it: spot negative projects and open them to understand why.
Step-by-step guide
Open the report
Go to Projects → Reporting → Profit/Loss Graph.
Identify outliers
Look for projects far below zero (loss) or unexpectedly high profits.
Open a project to explain “why”
Open the project and review Client Cost, Employee Expense, and External Expenses.
Fields table
| Field Name | Description | Example |
|---|---|---|
Project name |
The project being measured. |
“IT Consulting Services” |
Profit/Loss value |
The profit or loss amount calculated for that project. |
+7,300 (profit) or −500 (loss) |
Field name explanations
Project name
Use this to locate the project you want to investigate.
Profit/Loss value
A summary number. Use the project tabs to understand what created this result.
Tips
- Review on a schedule: weekly reviews catch issues early.
- Use it to start conversations: “Which projects should we look at today?” becomes easy.
- Follow up with actions: check unpaid payments, high time cost, or unexpected external expenses.
Common mistakes
- Assuming the report is for everyone: it’s commonly restricted to Administrators.
- Using the graph as the only truth: it’s a summary; the project tabs show the details.
- Not updating payment statuses: projects can look worse if client payments are still marked Unpaid.
Image